Study Techniques for Visual Learners: A Research-Backed Guide to Transform Your Learning
Why Visual Learning Actually Works (And How to Know If It's Right for You)
Most of us rely heavily on our vision to understand and remember information. When you see something with your own eyes – whether it's a diagram, chart, or image – it often sticks in your memory much better than if you just read or heard about it. But what makes visual learning so effective, and how can you tell if it's a good fit for your learning style? Let's explore the fascinating research behind visual learning and discover practical ways to apply it.
The Science of Seeing and Remembering
The human brain is remarkably attuned to visual information. Studies show that about 75% of all information processed by our brains comes through our eyes. This explains why you can often remember someone's face long after forgetting their name, or why a powerful image can stir up strong emotions more easily than words alone. In fact, your brain processes images 60,000 times faster than text, which means you can grasp visual concepts almost instantly. This built-in preference for visual information also explains why tools like diagrams, charts, and graphs can help you understand and remember complex ideas more effectively.
Are You a Visual Learner? Identifying Your Learning Style
While everyone can benefit from visual learning methods, some people find them especially helpful. You might be a visual learner if you often catch yourself drawing pictures while taking notes, or if you find it easier to understand data when it's presented in a graph rather than a written report. Do you prefer watching video tutorials over reading instruction manuals? Do you have a good sense of direction and notice small visual details others might miss? These signs suggest you might learn best through visual means. Understanding these natural preferences can help you choose the most effective study methods.
Unlocking the Power of Visual Learning: Practical Applications
Once you recognize your visual learning strengths, you can use specific techniques to improve your learning. Simple but effective methods include highlighting notes in different colors, creating mind maps to connect related ideas, and using flashcards with pictures. For example, when studying biology, drawing and labeling a diagram of the heart will likely help you remember its structure better than just reading about it. Similarly, turning numerical data into charts or graphs can make complex statistics easier to grasp and remember. These visual tools create clear mental pictures that help you organize and recall information more effectively.
By understanding how visual learning works and whether it matches your learning style, you can choose the right techniques to enhance your studies. In the following sections, we'll explore specific methods to help you turn abstract information into memorable visual concepts that stick in your mind.
Transforming Complex Information Into Visual Gold

Once you understand your visual learning style, you can start converting complex information into memorable visual formats. This is about more than just adding random images – it's about purposefully using visual tools to boost understanding and memory in ways that match how your brain naturally processes information. When you tap into visual learning methods, even challenging concepts become clearer and easier to grasp.
Visual Note-Taking: Beyond Just Jotting It Down
Think of your notes as a visual map rather than just lines of text. Instead of passively writing down words, actively engage with the material by adding visual elements. For instance, use different colored pens to highlight important points, sketch simple diagrams showing relationships between ideas, or create personal symbols for key concepts.
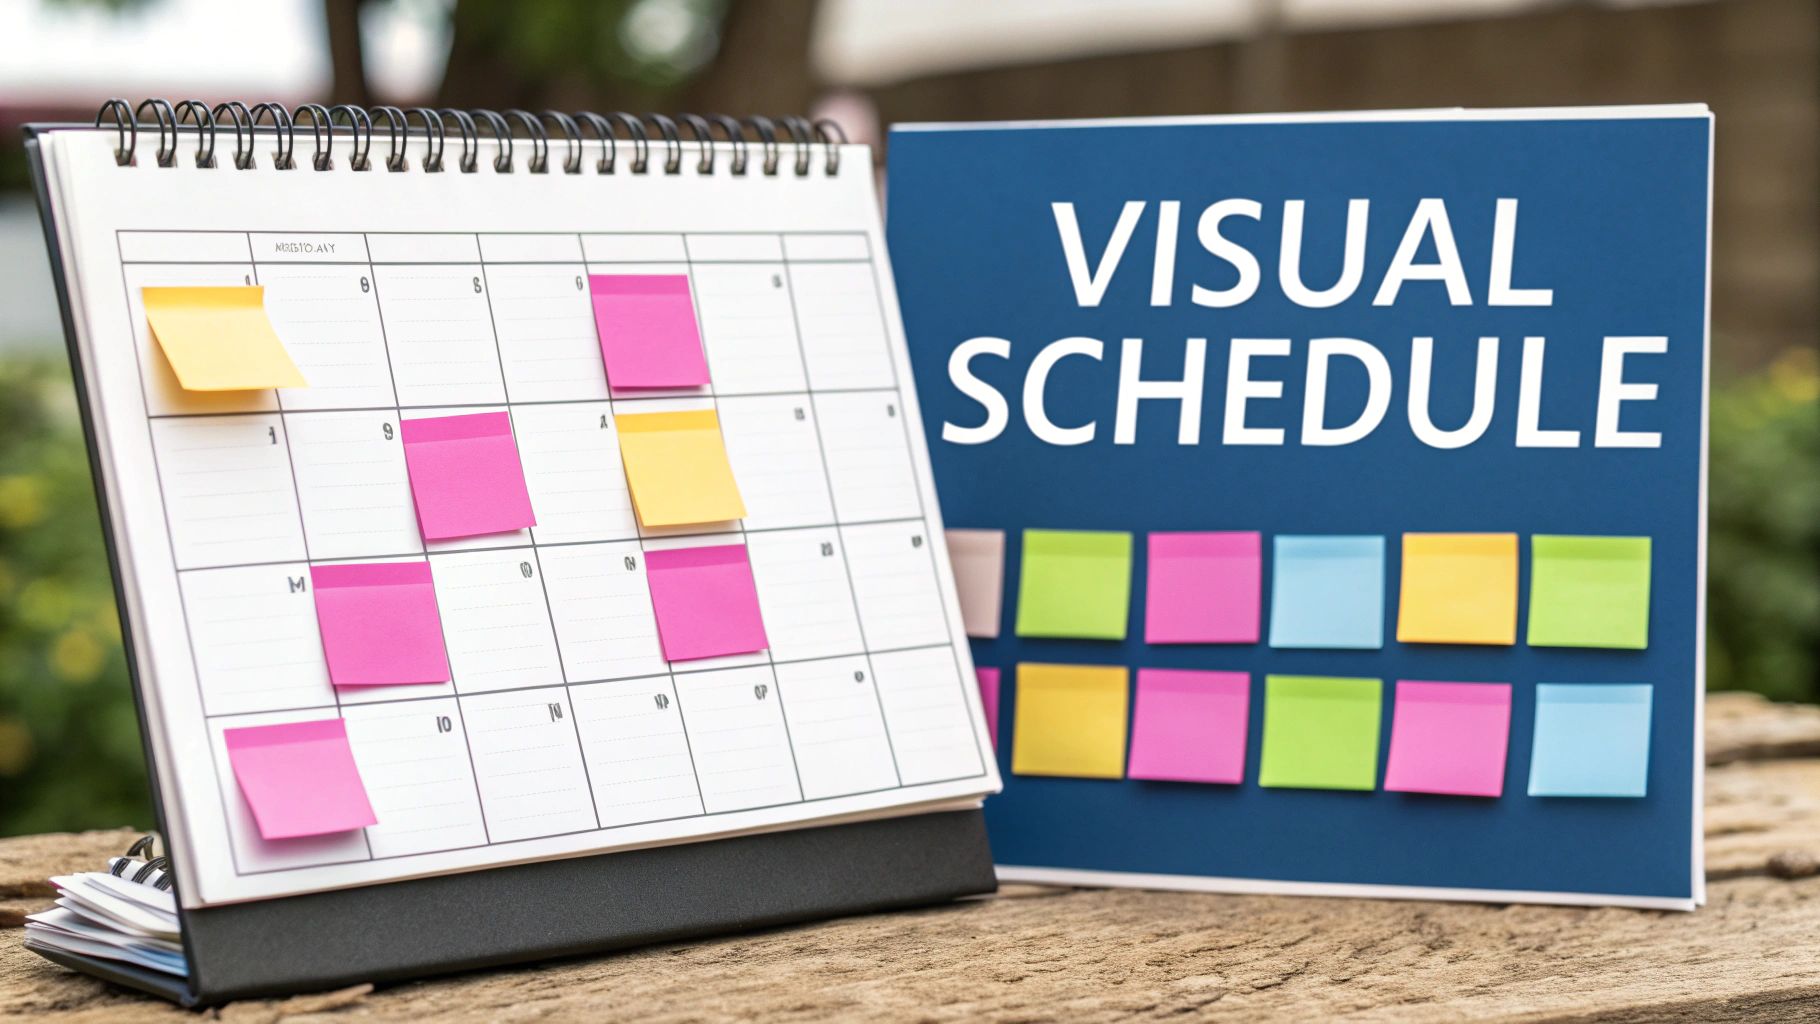
- Color-Coding: Give different types of information their own color scheme. Red might mark important dates, blue for key terms, and green for examples. This makes your notes visually clear while helping your brain quickly sort and remember information.
- Diagrams and Drawings: Simple sketches can explain complex ideas better than words alone. A quick drawing of a cell or flowchart of a historical event can help cement your understanding far more effectively than text descriptions.
- Symbols and Icons: Create your own set of symbols for common concepts. A star could show key points, question marks for topics to review later, and lightbulbs for moments when ideas connect. These visual markers make it easier to find and remember important information.
These visual elements serve as memory hooks, making it simpler to recall information when you need it.
Mind Mapping: Connecting the Dots Visually
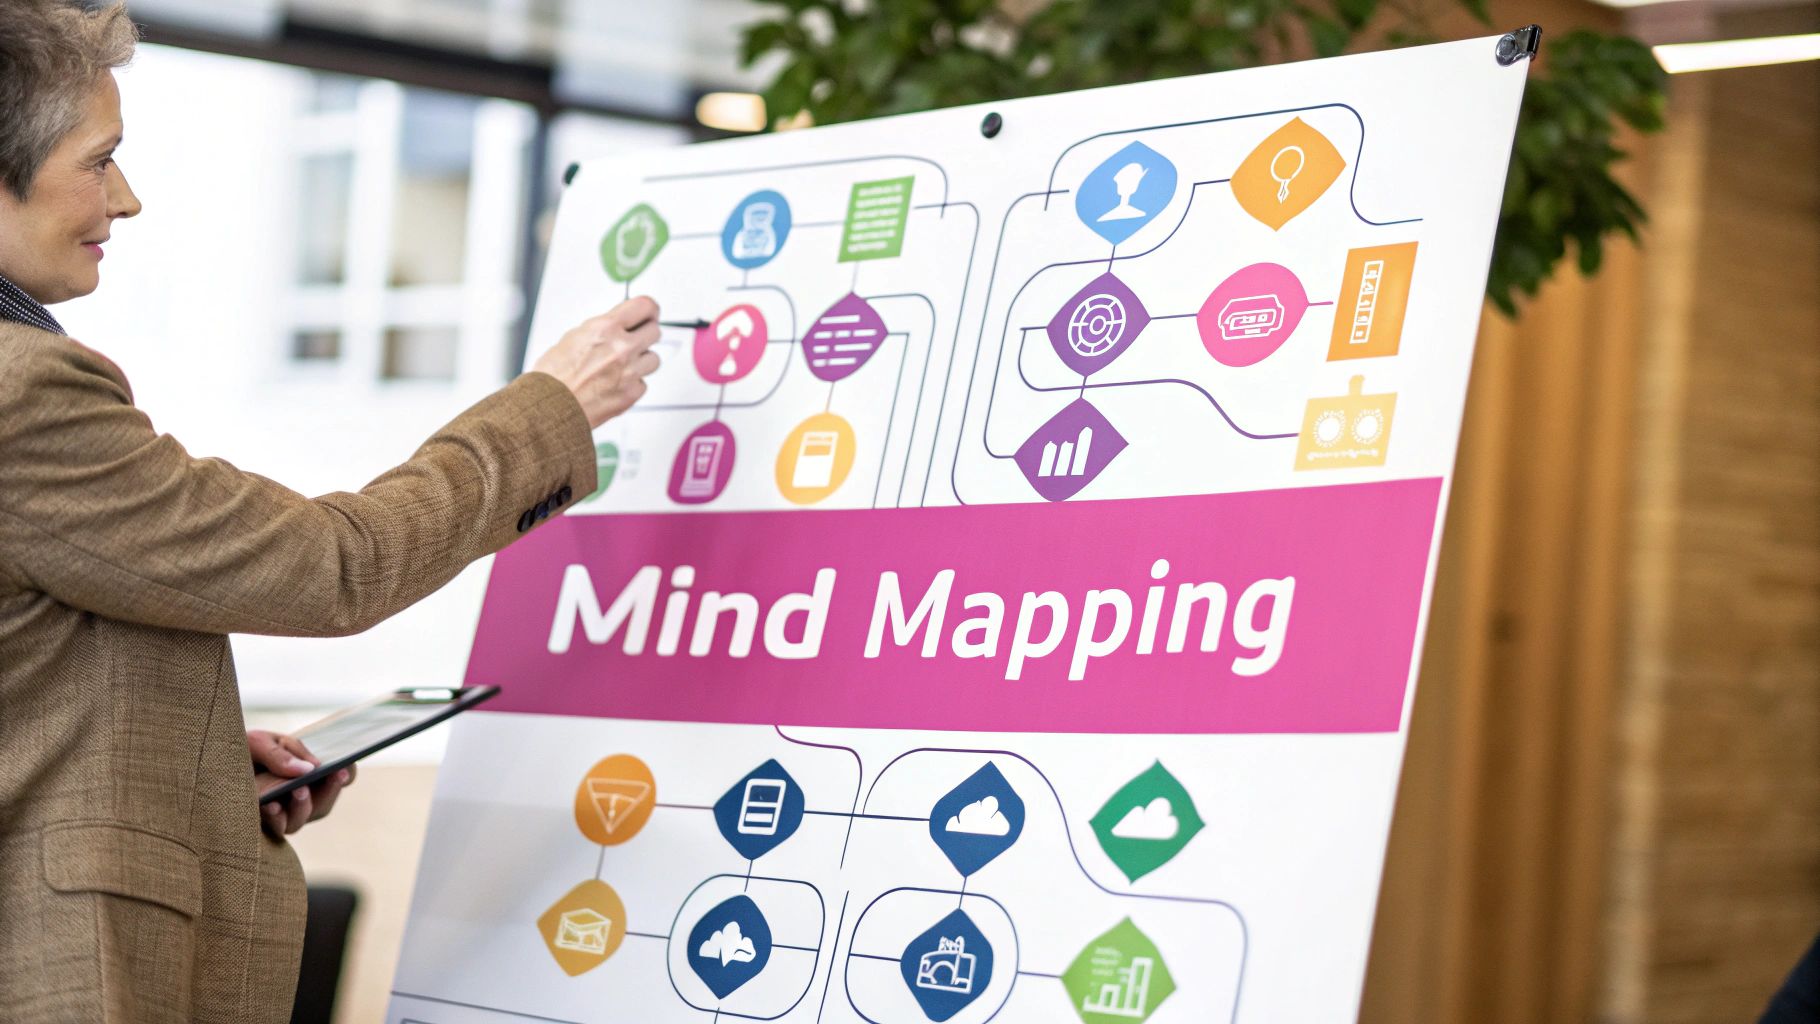
Mind mapping takes notes beyond linear format by creating visual networks of connected ideas. Start with your main topic in the center and branch out to related concepts using short phrases and keywords. This approach matches how our brains naturally link different pieces of information.
- Visual Hierarchy: Placing the main topic centrally with branching subtopics creates clear organization that helps you see how different ideas relate to each other. This helps you grasp both the big picture and the details.
- Spatial Relationships: The physical layout of information on a mind map helps with memory. Your brain remembers both the content and its location on the map, making recall easier.
- Creative Freedom: Mind maps let you personalize your learning. Add colors, images, and symbols to make your maps engaging and memorable in ways that work for you.
From Abstract to Concrete: Visualizing Abstract Concepts
Visual learners often struggle with abstract ideas, but even complex concepts can become clearer through visual representation. Analogies and metaphors help bridge this gap. For example, to understand entropy, picture a clean room gradually becoming messy over time. This concrete image makes the abstract concept easier to grasp. Similarly, break down complex processes into step-by-step flowcharts or diagrams. By applying these visual techniques, you can better understand, remember, and recall challenging information, making your visual learning style work to your advantage.
Making Data Your Friend Through Visualization

Numbers and data can feel intimidating for visual learners. However, the right study techniques can help transform this challenge into an advantage. By using visualization methods, you can convert abstract facts and figures into clear, memorable visual concepts that stick in your mind. Let's explore practical ways to make data more approachable through visual learning.
Visualizing Numerical Data: Seeing the Story Behind the Numbers
When working with quantitative information, converting it into visual formats makes it much easier to understand and remember. Rather than trying to memorize strings of numbers, focus on seeing patterns and relationships in the data. For instance, when studying population changes over time, a simple line graph showing the trend tells the story more effectively than paragraphs of text. Research shows our brains process images 60,000 times faster than text – a quick look at a well-designed chart can convey more meaning than minutes spent reading raw numbers. Since about 75% of brain processing involves visual input, these visualization techniques align with how we naturally learn.
Creating Visual Frameworks: Organizing Information for Clarity
Visual frameworks help structure complex information in logical ways that make it easier to digest. Mind maps are especially useful for connecting related concepts – start with your main topic in the center and branch out to subtopics using brief phrases and keywords. This mirrors how our brains naturally link ideas together. Adding color coding provides another layer of organization, like using different colors to mark various categories or highlight key points. The visual hierarchy makes relationships between ideas clear while colors help distinguish and group related information.
From Formulas to Flowcharts: Making Abstract Concepts Concrete
Visual techniques work well even for abstract concepts like mathematical formulas. Breaking down a complex equation into a step-by-step flowchart makes each part more tangible. Similarly, a diagram of photosynthesis showing how light energy becomes chemical energy explains the process more clearly than text alone. By converting abstract ideas into concrete visuals, you create stronger mental models and deeper understanding. This active engagement with the material through visualization leads to better retention and recall compared to passive reading. When you can truly see how concepts connect and flow together, you gain mastery that lasts.
Using Digital Tools for Visual Learning Success
Learning visually works best when you can see and interact with information, which is why digital tools can be so helpful. While there are many great options available, it's important to pick the right ones that match your needs without getting overloaded. Let's look at some effective digital tools and strategies that can help visual learners study better.
Best Digital Tools for Visual Learning
When information comes to life through images, videos, and interactive elements, visual learners can understand and remember it much more easily. The right digital tools can transform static text into engaging visual content that sticks in your memory.
-
Interactive Mind Mapping: Tools like Miro and XMind help you create visual maps that connect ideas and concepts. Rather than linear notes, you can build expandable webs of information with images, colors, and links. For example, you might map out the key themes of a novel, with branches showing how different characters and plot points connect.
-
Video-Based Learning: Platforms like YouTube, Khan Academy, and Coursera offer videos that explain complex topics visually. Watching someone work through a math problem or demonstrate a science experiment can be much more helpful than just reading about it. The visual demonstrations make abstract concepts concrete.
-
Visual Design Tools: Canva and Piktochart make it simple to create eye-catching visuals like infographics, diagrams, and presentations. You can take text-heavy information and transform it into clear visual formats. This helps both with understanding the material and remembering it later.
-
Visual Note-Taking Apps: Apps like Evernote, OneNote, and Notability let you add sketches, photos, colors, and highlights to your notes. Instead of plain text, you can create rich visual notes that match how you think. Color-coding different topics or adding relevant images next to key points can boost recall significantly.
Keeping Focus While Using Digital Tools
Digital tools are powerful for visual learning, but they can also pull your attention away from studying. Here's how to use them effectively while staying on track:
-
Set Up Your Digital Study Space: Create a dedicated folder structure for your study materials and keep your most-used tools easily accessible. Having an organized digital workspace helps you focus on learning rather than hunting for files.
-
Block Out Distractions: Turn off notifications and use apps like Freedom or Cold Turkey to block social media and other distracting sites during study time. Research shows that even brief interruptions can derail your concentration.
-
Work in Focused Blocks: Break study sessions into 25-minute focused periods using the Pomodoro Technique. Take short breaks between sessions to stay fresh. This structured approach prevents mental fatigue from too much screen time.
-
Choose Tools That Work For You: Pick digital tools that fit naturally into how you already study. Don't feel pressured to use every new app – focus on the ones that clearly help you learn better. Quality is more important than quantity when it comes to learning tools.
The right digital tools can make visual learning more effective and enjoyable. The key is selecting tools that support your learning style while having strategies to use them productively. This balanced approach lets you get the benefits of technology while avoiding its potential downsides.
Building Your Visual Learning Environment

The right study environment can make all the difference in how effectively you learn and retain information, especially if you're a visual learner. Just like a chef needs a well-organized kitchen to cook efficiently, visual learners need a carefully designed space that supports their learning style. Let's explore how to create both physical and digital environments that help you succeed.
Optimizing Your Physical Study Space
Your physical study area sets the foundation for productive learning sessions. Making a few key adjustments to your space can significantly improve your ability to focus and absorb information.
-
Lighting is Key: Clear visibility is essential for visual learners. Natural light works best – studies show it helps keep you alert while reducing strain on your eyes. When natural light isn't available, use a quality desk lamp with settings you can adjust throughout the day. This helps prevent eye fatigue during long study periods.
-
Strategic Organization: A tidy space promotes clearer thinking. Keep your study materials in clear containers and labeled folders that make visual sense to you. For instance, you might color-code your subjects – blue folders for math, green for science, etc. Having an organized system makes it easy to find what you need without breaking your focus.
-
Visual Hierarchy in Your Space: Arrange your study area to mirror how your brain processes information. Put current study materials directly in your line of sight, with less urgent items stored away. Try using a whiteboard for active learning – it's perfect for sketching out concepts and creating visual study aids that reinforce key ideas.
Mastering Your Digital Learning Environment
With so much learning happening online, setting up an effective digital workspace matters just as much as your physical one. Here's how to make your computer setup work better for visual learning:
-
Desktop Organization: A messy computer desktop can be just as distracting as a cluttered desk. Create a clear folder structure that matches how you think about your subjects or projects. Use descriptive file names so you can quickly spot what you need. This simple system saves time and mental energy you can put toward actual studying.
-
Use Visual Tools and Software: Take advantage of tools designed specifically for visual learners. Miro and Lucidchart are great for mind mapping, while Canva helps create visual study materials. These platforms make it easier to understand complex topics by turning them into clear visual concepts.
-
Minimize Digital Distractions: Notifications and social media can quickly derail your focus. Use website blockers during study time and set specific check-in times for email and messages. This creates periods of deep focus where you can fully engage with visual learning materials. When you control digital distractions, your online study environment becomes a powerful tool for mastering new concepts through visual techniques.
Advanced Visual Techniques for Critical Thinking

Visual learning techniques help you actively engage with and process information rather than just passively consume it. Let's explore some advanced visual methods that can strengthen your critical thinking abilities and help you create deeper understanding.
Visualizing Arguments: Concept Maps and Argumentation Diagrams
Breaking down complex arguments becomes much clearer with visual tools. Concept maps help you explore different aspects of an argument by starting with the main idea and branching out to supporting points, evidence, and potential counterarguments. For instance, when examining ethical AI development, you might place that as your central concept and create branches for topics like algorithmic bias, data privacy concerns, and workforce impacts. This visual layout makes it easy to spot relationships and gaps in reasoning. Argumentation diagrams take this a step further by using specific symbols to map out the logical flow between premises and conclusions, allowing for detailed analysis of an argument's structure.
Systems Thinking: Visualizing Interconnectedness
Understanding how different parts of a system affect each other becomes much clearer through visual tools like system maps. Take climate change as an example – a system map can show the connections between greenhouse gases, deforestation, ocean currents, and global temperatures. This birds-eye view helps reveal how changes in one area ripple throughout the entire system. For instance, increased deforestation doesn't just affect local ecosystems – it impacts weather patterns, biodiversity, and even economic stability across regions. These visual representations make complex systems easier to grasp and help identify effective solutions to systemic challenges.
Visual Problem-Solving: From Mind Maps to Flowcharts
Visual techniques can dramatically improve how you tackle problems. Mind maps excel at brainstorming by letting you branch out from a central problem to explore different solutions, resources, and potential roadblocks. This visual approach sparks creative thinking and ensures you consider multiple angles. Flowcharts complement this by mapping out step-by-step processes clearly. When optimizing a workflow, flowcharts help you trace each stage from start to finish, making it simple to spot inefficiencies or redundant steps. Converting abstract problems into visual formats gives you a clearer picture of the challenge and helps you develop targeted solutions.
By practicing these visual techniques, you'll become better at actively processing information rather than just absorbing it. These methods sharpen your critical thinking and give you practical tools for breaking down complex challenges. This improved analytical ability creates a strong foundation for success in both academic work and professional roles. Visual learning approaches can significantly boost how effectively you study and retain information.
Ready to supercharge your study sessions and transform your notes into engaging video lessons? Check out Notescast today! Notescast uses AI to create dynamic videos from your study materials, making learning more interactive and effective.
